


Measuring intangibles
Or "Why Stuart Bannigan is Great"

There’s quite a famous business book called “How to Measure Anything” - the premise is there are a lot of things in life that we don’t measure not because we don’t want or need to measure them but because we think that we can’t.
The author, Douglas Hubbard, argues that it’s worth measuring things if it helps you make a better decision, and the effort we should put into measuring something should be related to how much it improves the decision we make. Instead, we often measure what’s easy to measure rather than what’s valuable in improving our decisions because we don’t know where to start with the hard-to-measure things.
We over-measure what’s easy to measure (but not necessarily useful), and undermeasure what’s hard to gather data on even if making a small improvement in our decision-making by measuring something would give a huge payoff.
Traditionally, football commentators refer to this sort of attribute as ‘intangibles’. Some are psychological - players whose mental attributes help them be better than equally techncially- and physically-proficient peers (certain attributes in the Football Manager game are traditionally known to be ‘overpowered’ - players improve faster if they have high determination; players get way more assists if they have high vision, and get caught offside if they have low decisions or off-the-ball measures).
Some are termed ‘football IQ’ - making good decisions, just ‘knowing what to do’ in any given situation.
And some are what you could call '‘football osmosis’ - a player’s impact on the team that soaks outwards from his own impact into other players. It’s not just about their own contribution. It’s about what the team does when they’re around.
In 1994, the immensely talented Brazil side who won the tournament - Romario, Ronaldo, Cafu, Leonardo et al - were in many ways held together by captain Dunga in the heart of the midfield. He didn’t score or pass like some of the others. What he did was make the rest of the team better.
Measuring why is often hard. But you can certainly measure the impact.
I spent a bit of time this week playing around with simple events data, and joining it to the regular performance metrics I’ve been using so far. And I used it to build a simple ‘Plus-Minus’ model. The idea is to compare the goal difference a team generates when a player is on the pitch compared to when they’re not. It’s used quite heavily in Basketball (common examples are PER and RAPTOR / CARMELO) and I’ve always found it an interesting way of wrapping together a player’s individual stats into a single measure of their positive or negative contribution.
Ever-present players don’t feature much in this model, because you can’t compare them to much.
But one player for Thistle jumps out.
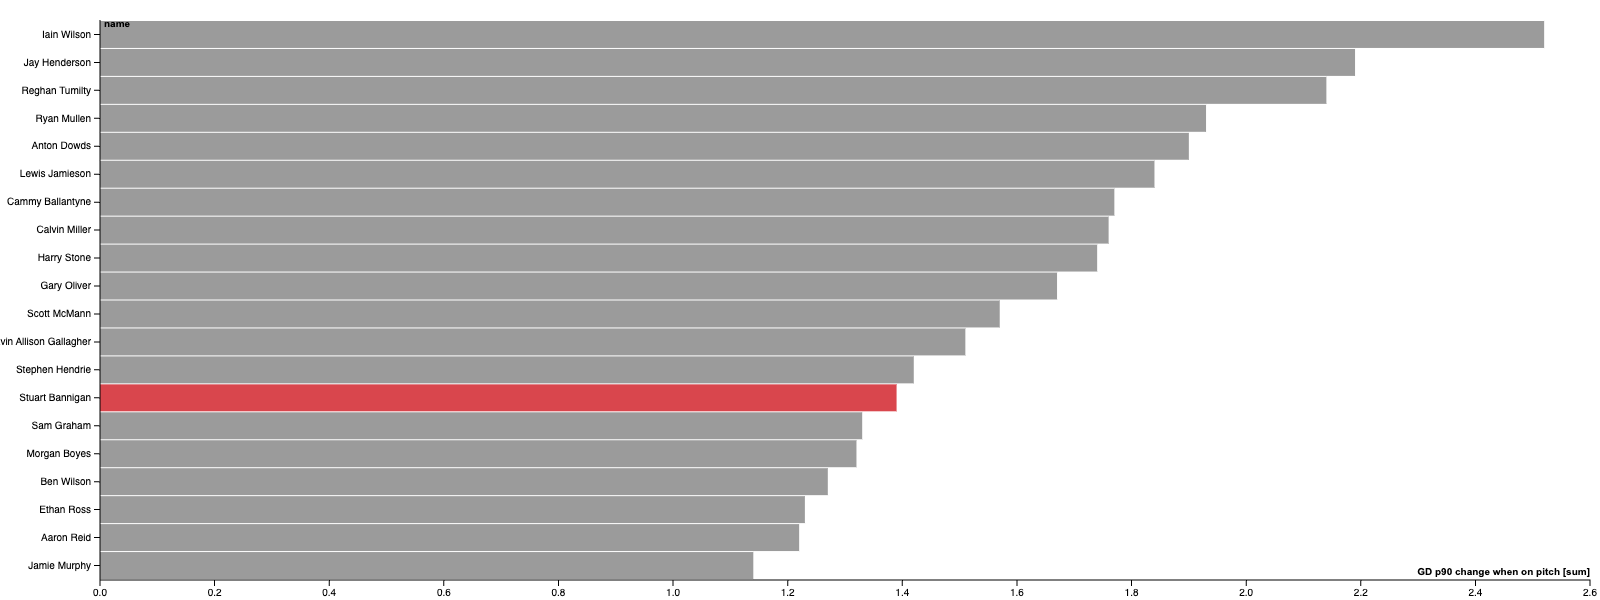
The chart below shows the increase in Goals Scored per 90 and increase in Goals Conceded per 90 when a player is on the pitch compared to how they do when a player isn’t there. I’ve included Thistle and Queen’s Park players who have played more than 300 mins over the season, and less than 100% of the minutes available (as we’re playing QP over the weekend).

Bottom right of this chart is good. Below the horizontal line means that when a player is on the pitch, their team concedes fewer goals than they do when they’re not on the pitch. To the right of the vertical line means their team score more goals when they’re on the pitch than when they’re not.
A player can have an overall negative impact on goals conceded (the team is more porous at the back when they play), but improve the attack by more than they damage the defence. The same goes another way. Some players just kill the game, make it really unlikely the opposition will score, but don’t help their team create much.
Stuart Bannigan has a massive impact when he’s on the pitch.
On average, when he’s on the pitch, our goal difference is +1.39 better per 90 minutes.
He makes our defence marginally better (our goals conceded per 90 is about 0.1 better), but our attack gets a lot better (~1.29 better per game).
He’s not the most impactful player in the division (that’s Morton’s Iain Wilson with a +2.52 impact), but he’s comfortably top 20.
There are several Falkirk and Ayr players who have a big positive impact, and Morton have four of the top twenty.
What’s also interesting is how big an impact Bannigan has on his team-mates, though.

Several players improve their contribution to the team when they share the pitch. When Aiden Fitzpatrick is on the pitch without Bannigan (~590 minutes), the team has a goal difference of -0.15 p90. When they’re on the pitch together, though (~670 minutes), it’s closer to +1.34.
Having Bannigan on the pitch seems to get the best out of Fitzpatrick. Perhaps it’s because it takes pressing and passing pressure off Fitzy’s shoulders so he can focus on running the ball. Or maybe there’s just a bit more support slightly behind and infield of him, so he’s not quite so exposed. Harry Milne is noticeably better too. Our wide left is so much better when Bannigan plays.
Even bigger is Robbie Crawford’s swing: +1.76 per 90 better with them in the team together compared to when Crawford’s on the pitch on his own. Early in Doolan’s reign, Doc and Bannigan were pretty crucial in our playoff push. They were the tic-toc of our ball progression. Putting a partnership together in central midfield lets our other players loose. I’m not saying Crawford is Doc 2.0 - far from it - but Bannigan has a pretty solid partnership with him, and knows how to bring out the best in Crawford’s impact on the team.
All in all, 11 players have a Goal Difference impact which is at least a goal per game better when Bannigan is on the pitch than when he’s not there with them.
I’ll do a bit more of a profile of Bannigan in future weeks, but even if you can’t measure exactly what he does, you can measure the impact he produces. Having him on the pitch makes the team outcome better, and makes his teammates noticeably better too.
We tend to lose him for a few games a season to suspension and injury, so it’s worth planning for this. But when Bannigan plays, we’re better. It’s hard to measure. But it’s worth measuring.
Who else?
Other honourable mentions for Thistle include Chalmers and Ashcroft who’re both have a slightly positive impact in both attack and defence when they’re on the pitch, and Scott Robinson who improves the attack a lot more than the small negative impact he has on defence.
For tomorrow’s opponents, Will Tizzard and Jack Turner are both in the ‘golden square’ double-positive impact. Zak Rudden and Roddy Macgregor also score well in both dimensions (I’d excluded them from the plot, as they’ve both played a lot of minutes, so the sample size ‘off the pitch’ is quite small which can lead to odd results).
Ryan Duncan (the Aberdeen loanee) increases both the goals his team score and concede by exactly 1.05 when he’s on the pitch. So it adds up to ‘no big change’ in the overall goal difference, but it’s fun to watch. Everyone loves a chaos merchant, right?
So what?
This is designed to be a metric that helps measure the efficiency of a player’s total impact on his team’s performance. In Basketball, there’s enough history to be able to classify players into players having an ‘all time season’ and ‘good rotation player’ profiles. Eventually I’m going to try to use it to do a bit of player stratification (for example - Iain Wilson is having a great season) and maybe some recruitment ideas.
For now, it’s enough to say - whilst you can’t measure everything he does, what you can measure shows that Bannigan is really important to our team and our success.